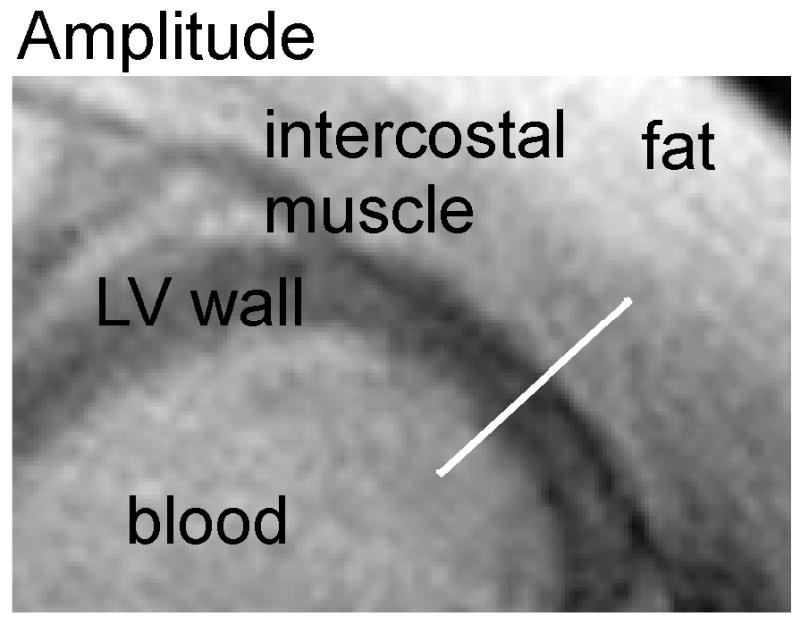
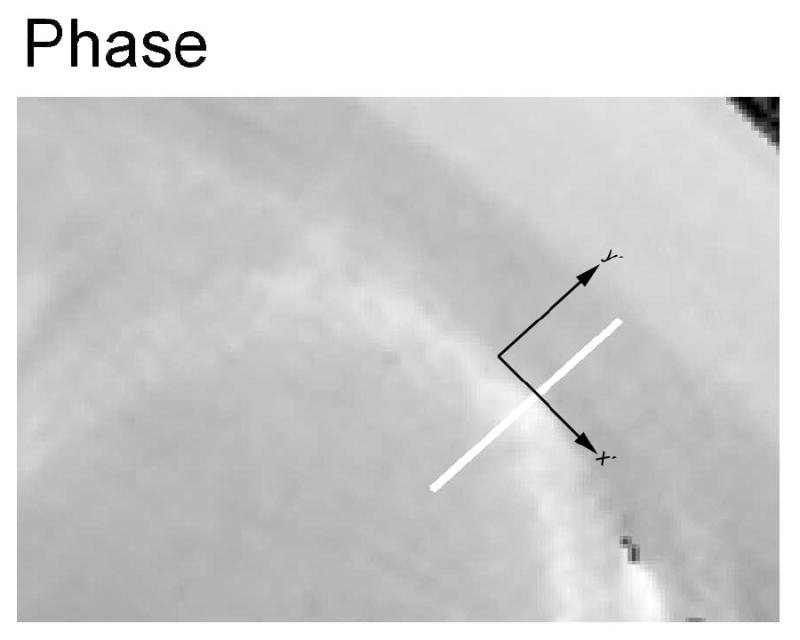
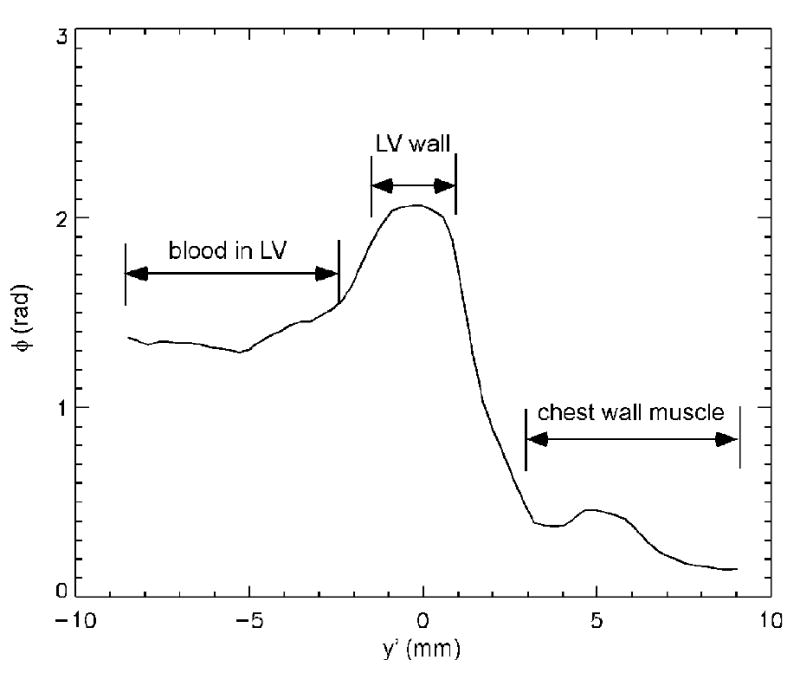
Figure 3.


Transverse amplitude image (A), phase image (B) and phase profile (C) in a patient with iron overload. (A): the LV cardiac wall has decreased signal intensity compared with the intercostal muscle on the amplitude image, owing to an increase in R2*. (B): the signal phase of the LV cardiac wall is increased relative to the intercostal muscle, due to an increase of the magnetic susceptibility in the cardiac tissue. The x′ and y′ axes are the same as that referred to in Figure 1. (C): the phase profile along the white bar in y′ direction of the amplitude/phase image with the magnetic field Bo perpendicular to the image plane.
