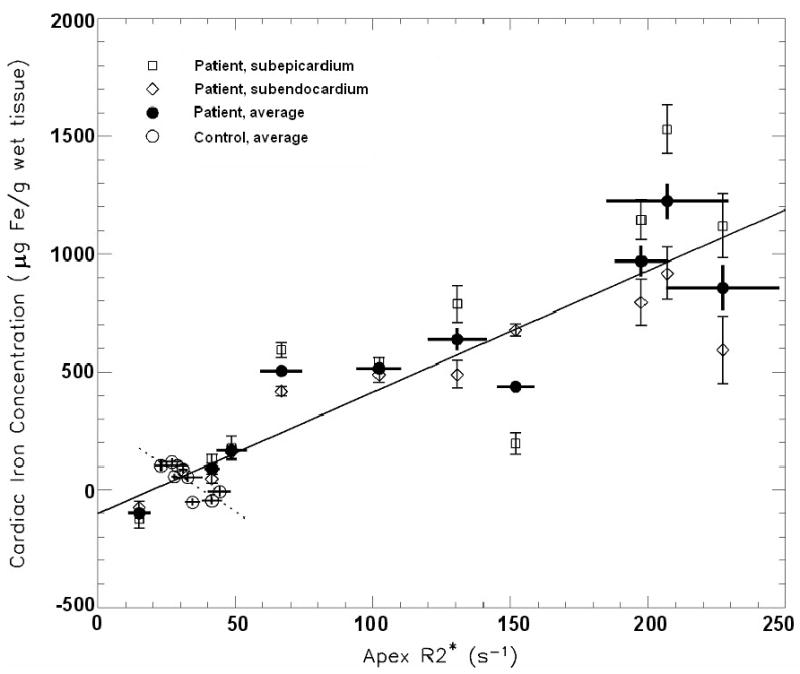
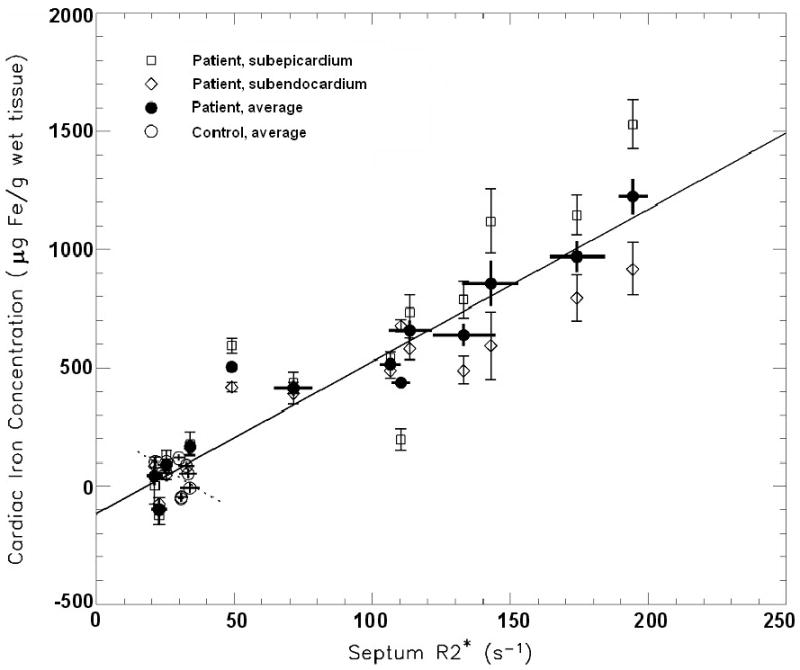
Figure 5.


Correlation between R2* and the averaged subendocardial and subepicardial iron concentration (CICavg) from the anterior apical left ventricular cardiac wall. (A) Correlation between apical R2*apex and CICavg for patients and controls (solid line: r = 0.93, p < 0.001) and, separately, for control subjects (dotted line: r = -0.80, p < 0.01). (B) Septal R2*septum correlated with CICavg in patients and controls (solid line: r = 0.96, p < 0.001), but not significantly for control subjects only (dotted line: r = -0.45, p = 0.22)
