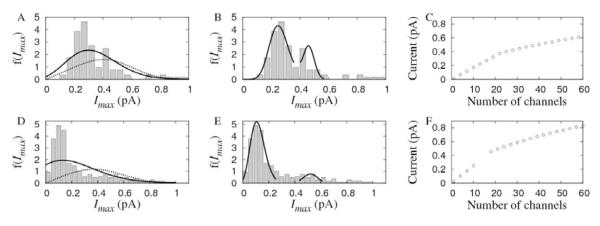
Figure 5.
Current distribution functions for Fluo-4 (A, B) and Oregon green (D,E) experiments. Bars: experimental data. Lines: Theoretical expressions. A: Theoretical expression given by Eq. 15 with α=1, Io=0.086pA, m=4 (solid line) and with α=2, Io=0.45pA and m=0.72 (dashed curve). B: Theoretical expression given by Eq. 16-17 with I1*=0.36pA, I2*=0.4pA, λ1=0.71, α1=1, Io1=0.017pA, m1=15, λ2=0.27, α2=2, Io2=0.08pA and m2=33. D. Theoretical expression similar to A, but with α =1, Io=0.19pA, m=1.22 (solid line) and with α =2, Io=0.56pA and m=0.32 (dashed curve). E: Theoretical expression similar to B but with λ1=0.71, α1=1, Io1=0.025pA, m1=4.72, λ2=0.11, α2=2, Io2=0.107pA and m2=23.6. C, F: Current vs Np relationship given by Eq. 14 with Io1=0.017pA, Io2=0.08pA and Npt≈22 in C and with Io1 = 0.025 pA, Io2 = 0.107pA, in F.

