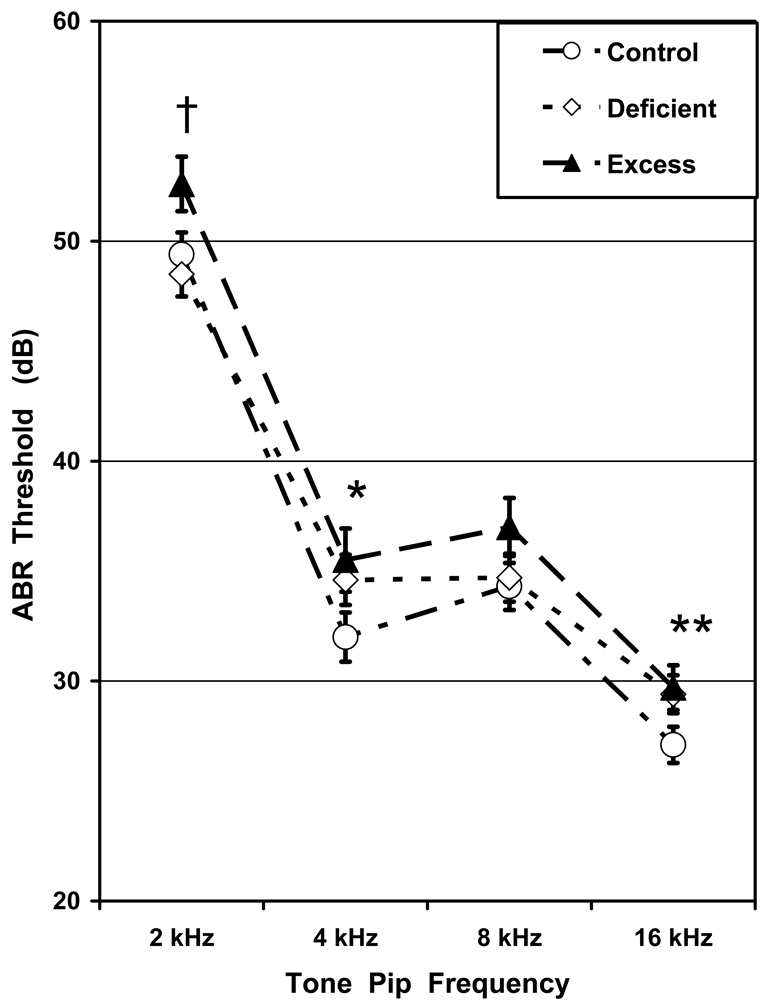
Fig. 3. ABR thresholds.
Mean±SEM ABR thresholds as functions of Diet group and Tone Pip Frequency. The Excess offspring had elevated (worse) thresholds than their Control and Deficient cohorts: *Excess different from Control; †Excess different from Control and Deficient; **Excess and Deficient different from Control.

