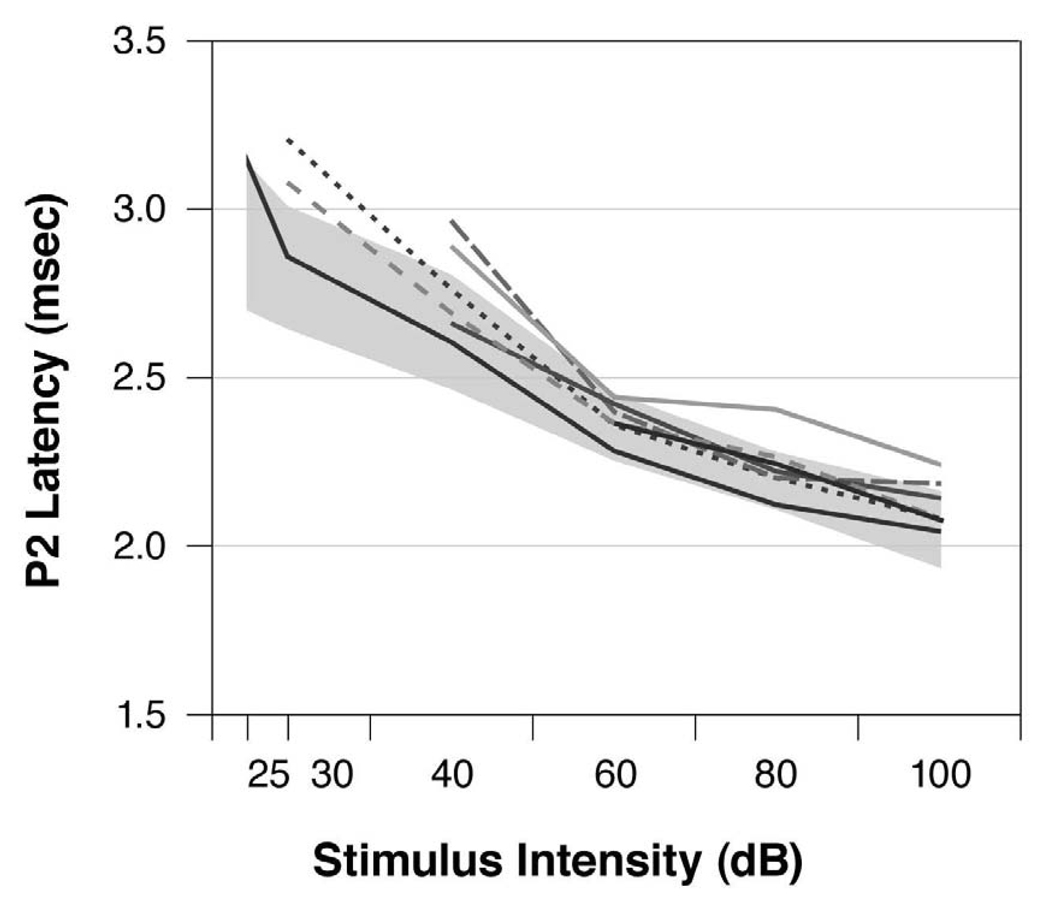
Fig. 5. L-I profiles.
ABR latency-intensity (L-I) profiles elicited by 16 kHz tone pips from the seven Excess offspring with abnormality. The shaded region is the range of normalcy for the P2 wave’s latency (mean±2 SD) as derived from the Control group data. Five of these Excess offspring had L-I profiles that fell above the range of normalcy at the lower stimulus intensities, suggesting sensorineural hearing loss (SNHL). Six of the Excess offspring had no ABRs at the lower stimulus intensity levels.

