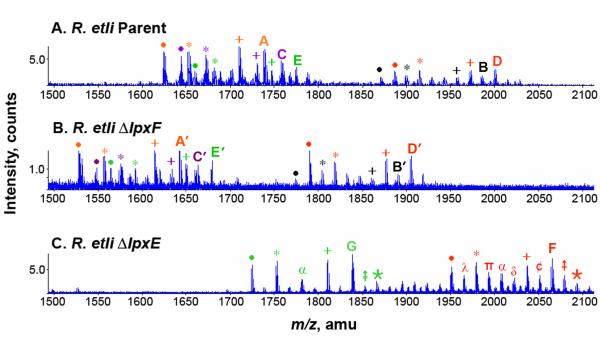
Figure 5. ESI/MS analysis of lipid A species released by acetic acid hydrolysis from wild-type and single phosphatase mutants.
The lipid A released from the wild-type or the phosphatase deletion mutants by 1% acetic acid hydrolysis was analyzed by negative ion ESI/MS. Panel A. The peaks in the singly charged region corresponding to the four major components of wild-type R. etli lipid A (B, C, D, and E), shown in Figs. 1B and 1C, are labeled and color coded. Component A (Supporting Fig. 3) is an elimination artifact derived from D during hydrolysis [14, 15]. There is additional micro-heterogeneity (see below) with regard to acyl chain length or the presence of the β-hydroxybutyrate substituent for each component, in agreement with previous studies [13]. Panel B. The spectrum in the singly charged region of the lipid A from the LpxF 4′-phosphatase mutant shows the same relative pattern of peaks as the wild-type, but each component (B’, C’, D’, and E’) is shifted by 96 amu because of the replacement of the 4′-galacturonic acid moiety with a phosphate group (Fig. 3A). Panel C. The spectrum in the singly charged region of the lipid A species from the LpxE 1-phosphatase mutant (Fig. 3B) show peaks at increased m/z values because of the retention of the phosphate group at the 1-position. There are also fewer lipid A components in this mutant because oxidation of the proximal glucosamine unit by LpxQ cannot occur. The hydrolysis artifacts (A and A’), seen in wild-type R. etli and mutant CS506 respectively, are therefore not present in this strain. Additional micro-heterogeneity in fatty acid chain length (14 or 28 atomic mass units) and partial substitution with β-hydroxybutyrate (86 amu) is observed in the lipid A species of all these strains. Each major lipid A species and some of its corresponding acyl chain variants are grouped by color. Symbols indicate the following amu shifts: for Panels A and B: + = (−28) * = (−86) • = (−86 and −28); for Panel C: + = (−28) * = (−86) • = (−86 and −28)  = + 28 28)
  = +14 α = (−86 and + 28) ¢ = −14 π = (−86 and + 14) ∂ = (−86 and + 14 and + 28) λ = (−86 and −14).

