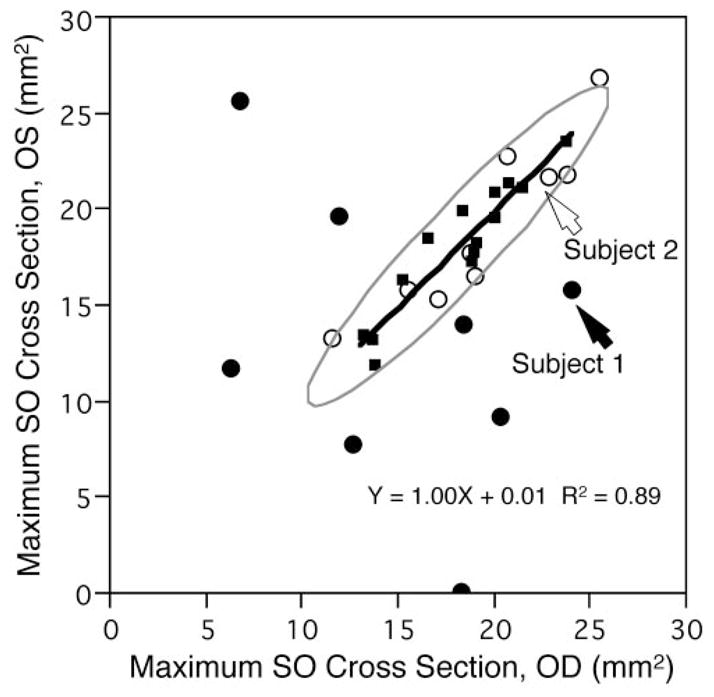
Figure 2.

Comparison of maximum SO muscle cross-sectional area between right and left eyes. Ninety-five percent bivariate normal ellipse (gray) was computed from SO cross sections of 14 normal subjects. (○) Nine subjects clinically diagnosed with SO palsy but having almost normal SO cross-sectional area. (●) Eight subjects with clinically diagnosed SO palsy having subnormal SO cross-sectional area. (■) Data of 14 normal subjects. Solid line: linear regression through data points of the normal subjects with slope significantly differing from 0 (P < 0.0001).
