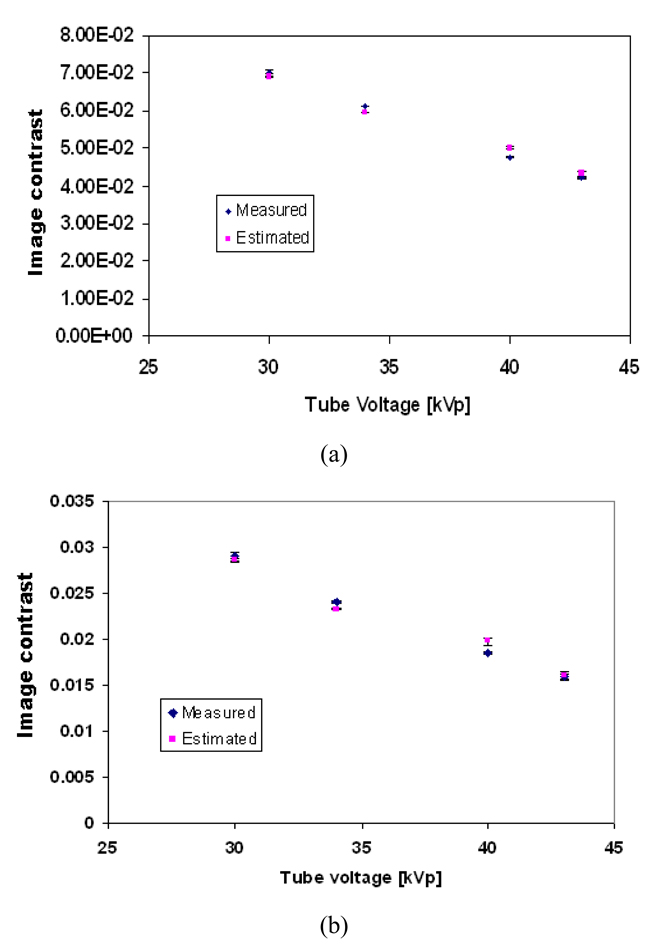
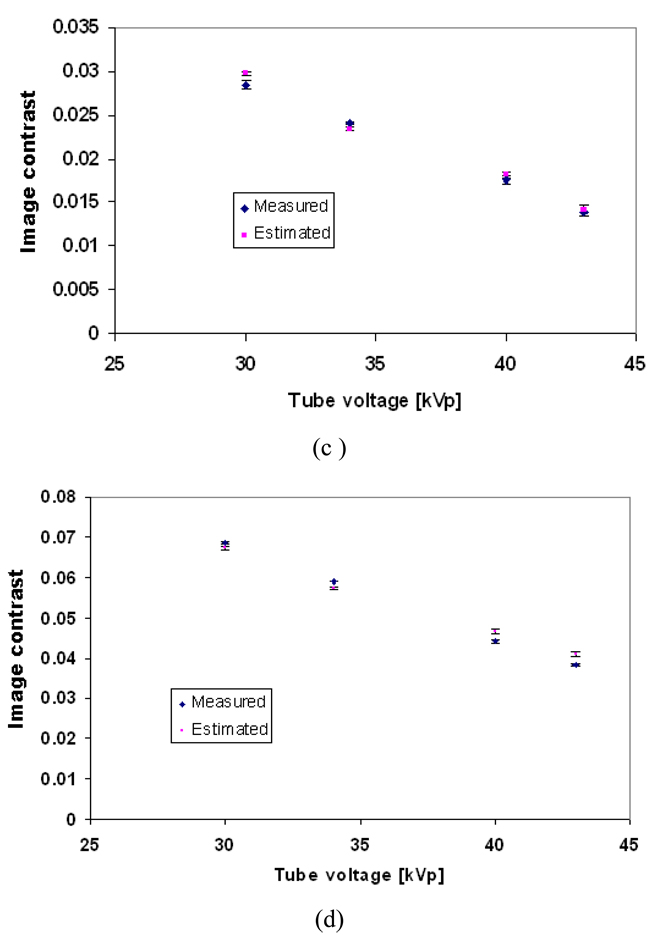
Figure 10.
The mean estimated and measured image contrast of different structures in the phantom as a function of tube voltage (a) 100% glandular tissue; (b) 30:70 glandular/adipose; (c) 70:30 glandular/adipose; (d) 100% adipose tissue. The error bars indicate the range in the image contrast, as three image contrast readings were taken at each setting.


