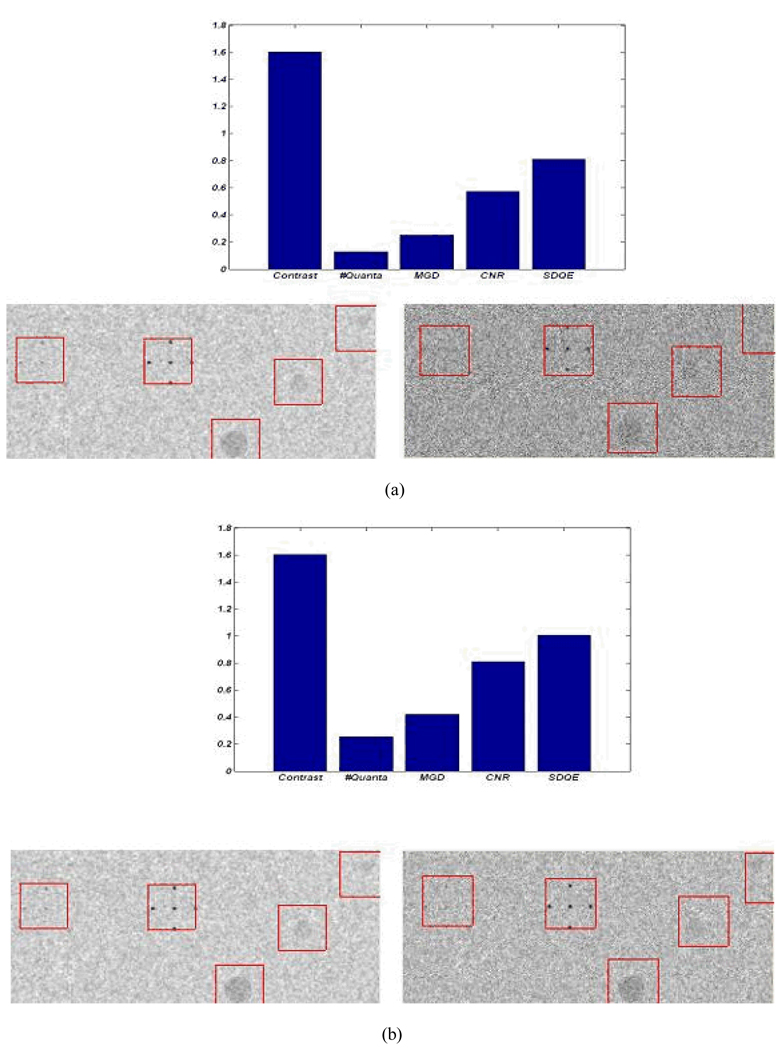
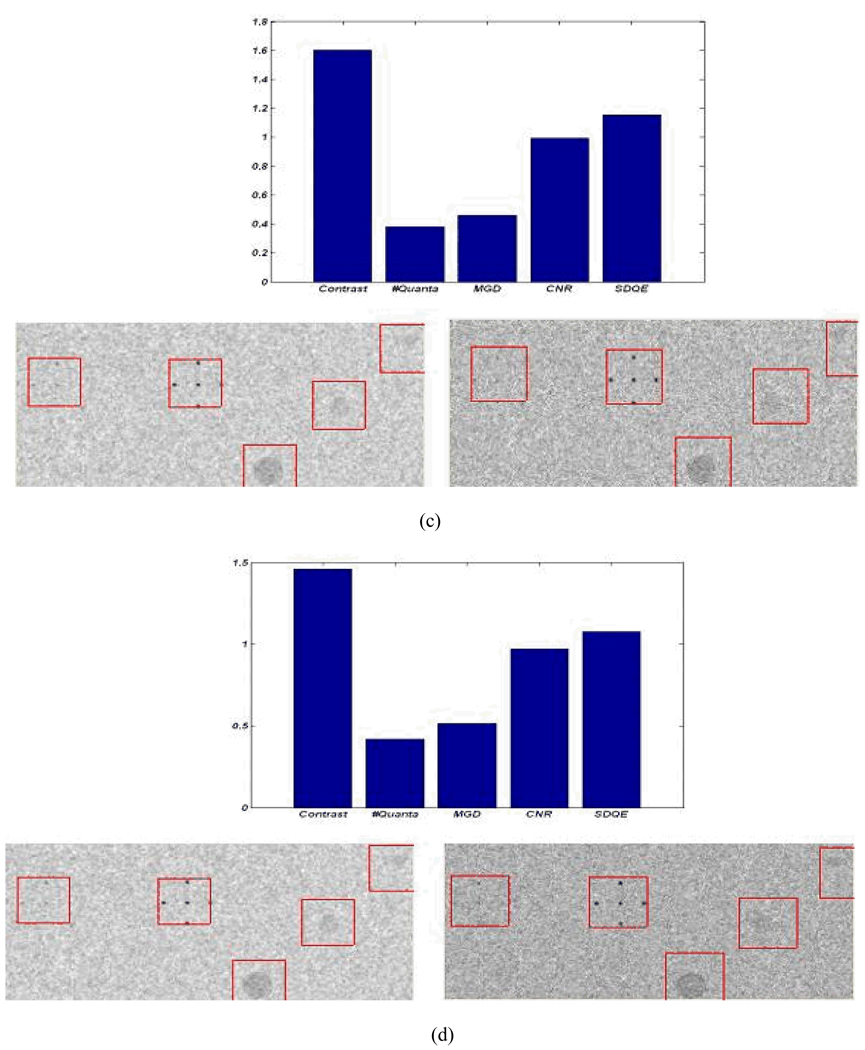
Figure 14.
The image performance of the polychromatic (left) and the monochromatic (right) beams at tube voltage (30kVp) and tube current (100mA) - the polychromatic beam is the unfiltered spectrum shown in Figure 13 and the monochromatic beam is tuned to 19 keV; (a) performance using the same technique factors; (b) doubling the scanning time of the monochromatic beam; (c) tripling the scanning time of the monochromatic beam; (d) doubling the scanning time and using FWHM of 25% rather than 10% for the monochromatic beam.


