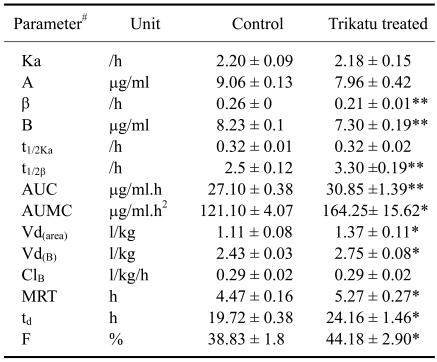
Table 1.
Comparative pharmacokinetic profile of pefloxacin administered orally (20 mg/kg) in control and trikatu treated goats (mean ± SE)
#Pharmacokinetic parameters as described by Gibaldi and Perrier [5], Ka: absorption rate constant, A: zero time plasma drug concentration intercept of regression line of absorption phase, β: overall elimination rate constant, B: zero time intercept of the regression line of the elimination phase, t1/2Ka: absorption half life, t1/2β: elimination half life, AUC: area under the curve, AUMC: area under the first moment of the plasma drug concentration time curve, MRT: mean residential time, td: total duration of pharmacological action, ClB: total body clearance; Vd(area): volume of distribution based on the total area under the plasma drug concentration time curve; Vd(B): volume of distribution based on the zero time plasma drug concentration intercept of the elimination phase. *p ≤ 0.05, **p ≤ 0.01.

