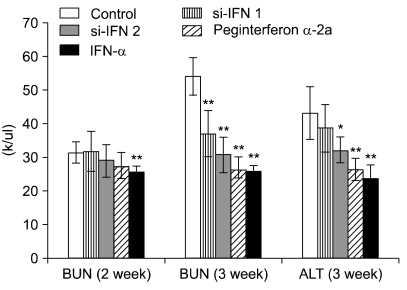
Fig. 3.
Concentrations of blood urea nitrogen (BUN) and alanine aminotransferase (ALT) in the 50 × interferon group. BUN and ALT were measured after tumor cells inoculation (n = 5). 50 × interferon group: concentration of si-IFN1 and si-IFN2 (150 µg/kg), Each point represents the mean ± SD. *Significantly different from control (p < 0.05). **Significantly different from control (p < 0.01).

