
FIGURE 1.
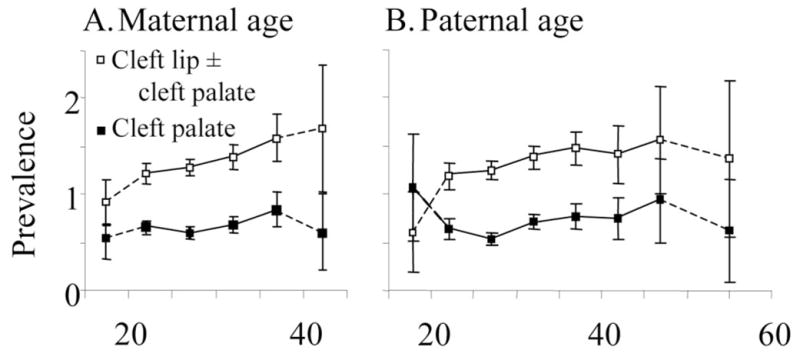
Birth prevalence of cleft lip with or without cleft palate and cleft palate only per 1000 live births in relation to mean (A) maternal age and (B) paternal age in 5-year intervals. The data points are placed at the mean age in each interval. The extremes (maternal age <20 and >40, paternal age <20 and >50) are grouped as a result of relatively small numbers.