Figure 2.
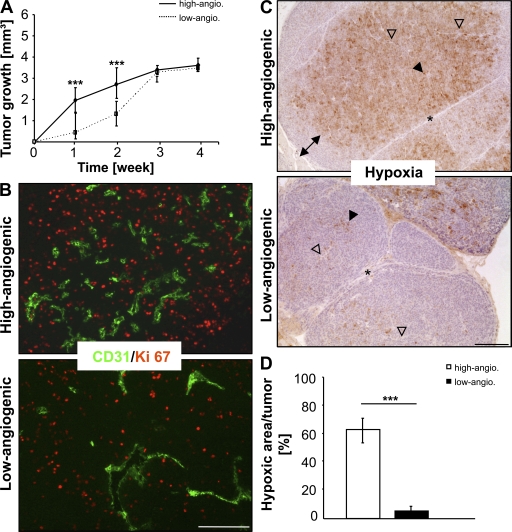
Comparative analysis of tumor growth rate, tumor cell proliferation, and induction of hypoxia in MT/ret transgenic mice. (A) Tumor growth curve of high and low angiogenic-active melanoma. Tumor volume (in millimeters cubed) of individual nodules was measured weekly over a period of 4 wk in mice of concordant sex and age using fl-VCT (n = 10 tumors/mouse). The experiment was independently performed three times using five mice (***, P ≤ 0.001). (B) Immunofluorescence labeling of tumor cell proliferation using double staining of the proliferation marker Ki-67 (red) and the endothelial marker CD31 (green) in tumors of high and low angiogenic potential (n = 15 tumors/vascular phenotype of five mice, analyzed in five separate experiments). (C) Immunohistochemical assessment of hypoxic areas in high and low angiogenic-active tumors using pimonidazole injection (n = 10 tumors/vascular bed of three mice). Filled arrowheads indicate selection of hypoxic tumor cells, empty arrowheads show tumor vessels, the double-headed arrow indicates the hypoxic-free tumor margin, and the star indicates tumor septa. Injection experiments were independently performed three times with the corresponding outcome. (D) Quantification of hypoxic area per tumor (in percentage) in high and low angiogenic-active tumors (n = 10 tumors/vascular bed of three mice) of three independent experiments; ***, P ≤ 0.001. Representative images are presented (B and C). Error bars, mean ± SD. Bars, 100 µm.

