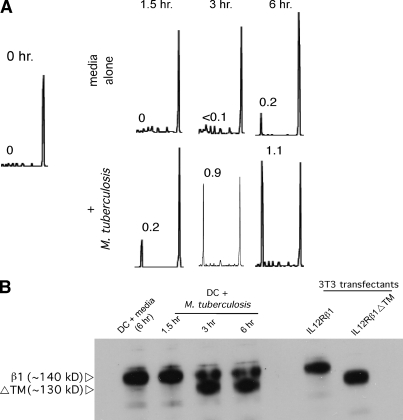
Figure 5.
IL-12Rβ1 Spectratype analysis of M. tuberculosis-activated DCs. (A) C57BL/6 BMDCs were stimulated over a period of 6 h with media alone or M. tuberculosis. Shown are representative IL-12Rβ1 spectratype data from these DCs before culture (0 h) and after 1.5, 3, or 6 h of culture. The numbers adjacent to peaks of an individual IL-12Rβ1 spectra indicate the relative ratio of that peak’s area (the smaller peak representing IL-12Rβ1ΔTM) to the area of the larger peak that represents IL-12Rβ1. Spectra are representative of four BMDC cultures per condition; this experiment was performed twice. (B) Denaturing Western blot analysis of the same cells to confirm changing protein levels of IL-12Rβ1 and IL-12Rβ1ΔTM; NIH/3T3 cells transfected with the indicated plasmid constructs served as positive controls; blots were probed with polyclonal anti-IL-12Rβ1.

