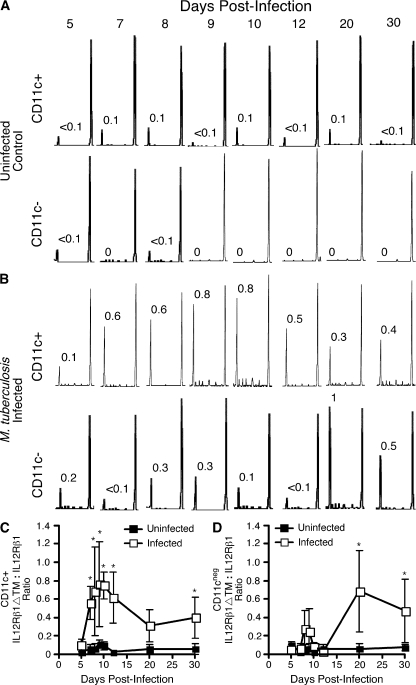
Figure 7.
Lung CD11c+ and CD11c− populations increase IL-12Rβ1ΔTM expression after M. tuberculosis infection. C57BL/6 mice were aerogenically infected with 100 CFU M. tuberculosis. At the indicated times after infection lung CD11c+ and CD11c− populations were magnetically separated from both (A) uninfected and (B) infected mice. Subsequently generated cDNA was used for IL-12Rβ1 spectratype analysis. Shown are representative spectra expressed by CD11c+ and CD11c− cells from (A) an individual uninfected mouse at each time point or (B) an individual M. tuberculosis—infected mouse at each time point. The numbers adjacent to peaks of an individual IL-12Rβ1 spectrum indicate the relative ratio of that peak’s area (the smaller peak representing IL-12Rβ1ΔTM) to the area of the larger peak that represents IL-12Rβ1. Spectra are representative of four mice per time point. (C) The ratio of IL-12Rβ1ΔTM to IL-12Rβ1 expressed by lung CD11c+ cells from uninfected and M. tuberculosis—infected animals. (D) The ratio of IL-12Rβ1ΔTM to IL-12Rβ1 expressed by lung CD11c- cells from uninfected and M. tuberculosis-infected animals. Data points in (C and D) represent the mean and SD of the IL-12Rβ1ΔTM to IL-12Rβ1 ratios expressed in four individual mice per time point; for the difference between the indicated populations from infected lungs relative to uninfected lungs, *, P < 0.05, as determined by Student’s t test.

