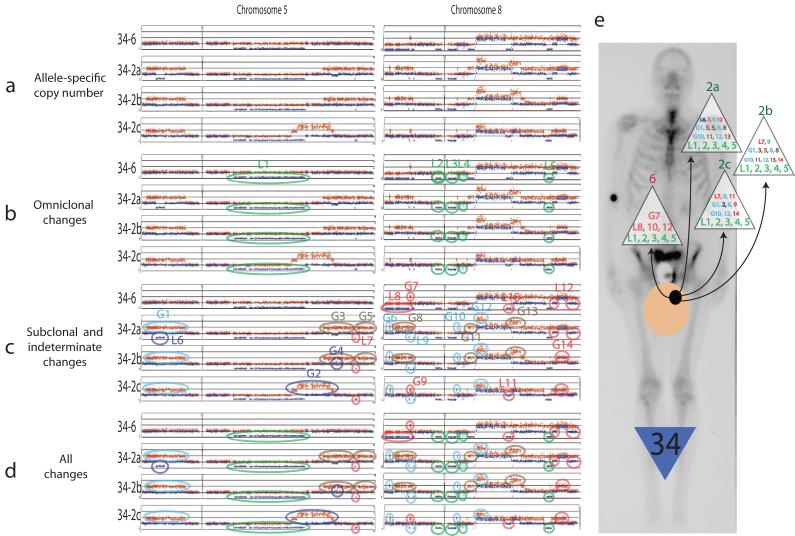
Figure 3a. Representative sample of allele-specific copy number data from subject 34 (chromosomes 5 and 8).
3b: Changes present in all samples are termed omniclonal (circled in green). 3c: Subclonal changes are present in just one (dark blue), a pair (brown) or three of the samples (light blue) studied. Indeterminate changes are circled in pink. 3d: Summary of all changes detected. 3e: Depiction of detected changes at each metastatic site studied, superimposed on posterior bone scan view with tan circle representing prostate, black circle representing cancer capable of metastasis.

