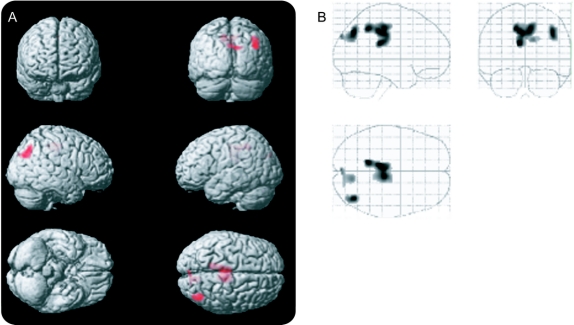
Figure 3 Amyotrophic Lateral Sclerosis Functional Rating Scale positive correlation with arterial spin labeling (ASL) perfusion (left = ipsilateral)
Voxels exhibiting increased ASL perfusion with increased number of finger taps. Voxels were only included if they were in clusters of at least 100 voxels (p < 0.001). The images in A project these voxels onto a 3-dimensional rendering of the Montreal Neurological Institute atlas. The images in B display these same data as a maximum intensity projection on a transparent “glass brain.” The dashed lines indicate the extent of the brain that was covered by the ASL perfusion images.

