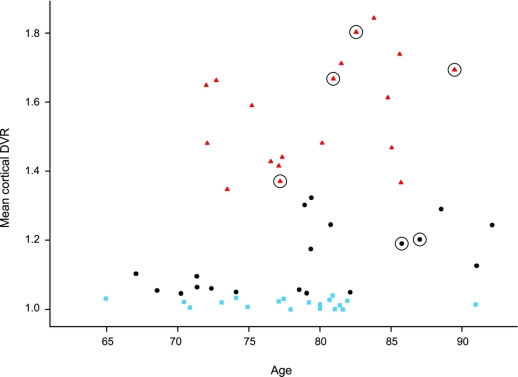
Figure 1 Distribution of mean cortical [11C]PiB retention in older adults without dementia by tertile of mean distribution volume ratio
Individuals in the highest tertile are shown as red triangles, in the middle by black circles, and the lowest by blue squares. The 6 older adults with CDR = 0.5 are shown by circled symbols.

