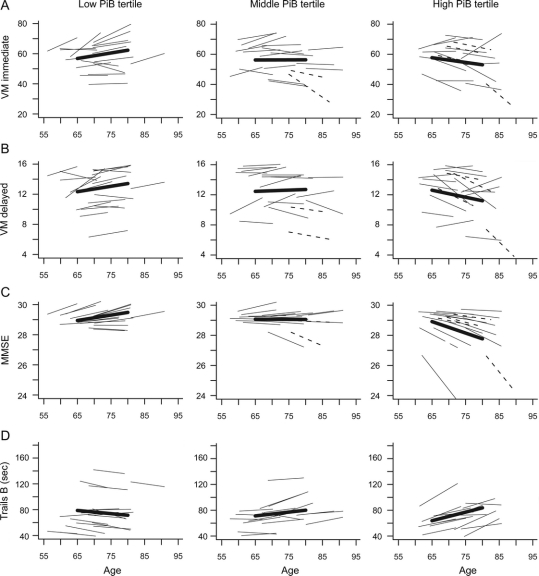
Figure 2 Predicted longitudinal trajectories by tertile of PiB mean distribution volume ratio for cognitive tests showing significant longitudinal decline in association with higher Aβ burden
Mean trajectories for each tertile are shown by bolded lines, and trajectories for participants with CDR = 0.5 are shown as dashed lines. (A) Verbal episodic memory, immediate recall (p < 0.01); (B) verbal episodic memory, delayed recall (p < 0.01); (C) Mental Status (p = 0.01); (D) executive function measured by Trails B in CDR = 0 individuals (p = 0.02). Note that higher scores reflect poorer performance for Trails B. CDR = Clinical Dementia Rating; MMSE = Mini-Mental State Examination; VM = verbal memory.

