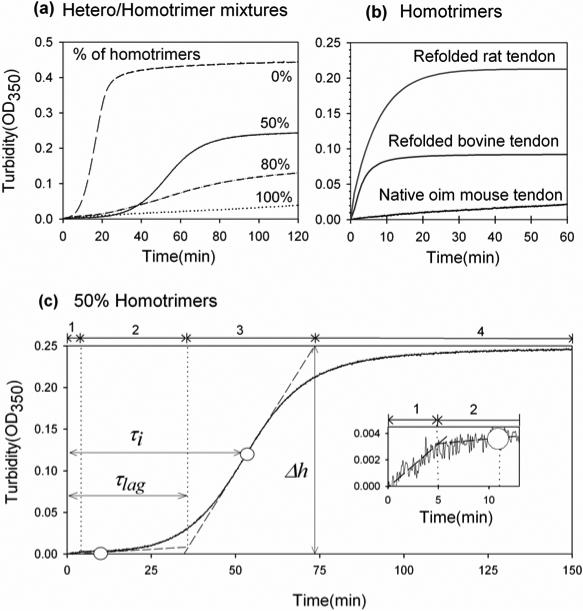
Figure 1.
Fibrillogenesis kinetics in hetero/homotrimer mixtures of type I collagen: (a) 0.3 mg/ml mixtures of type I collagen from wild type (heterotrimers) and homozygous oim (homotrimers) mice in 30 mM sodium phosphate, 0.13 M NaCl, pH 7.4; (b) homotrimers from homozygous oim mouse tendons (100% curve in Fig1.(a)), bovine Achilles tendons (refolded, 0.36 mg/ml, 30mM sodium-phosphate), and rat tail tendons (refolded, 0.25 mg/ml, 20mM sodium-phosphate); (c) 1:1 mixture of mouse heterotrimers and homotrimers (50% curve in (a)). In (c), the white circles show two inflection points on the turbidity curve; the dashed tangential lines indicate turbidity trends at different fibrillogenesis steps; the vertical dotted lines separate four fibrillogenesis steps: 1-early growth, 2- lag phase, 3- delayed growth, and 4- high plateau; the inset shows the early kinetics. The small, lag-less turbidity rise during the early growth was reproducible. It occured only at sufficiently high homotrimer concentrations and it was consistent with the rapid appearance of small aggregates observed by confocal microscopy. Note that the lag phase and high plateau might be difficult to see in Fig 1a for the 80% curve, but both steps were clearly distinguishable when this curve was plotted separately on a larger scale.

