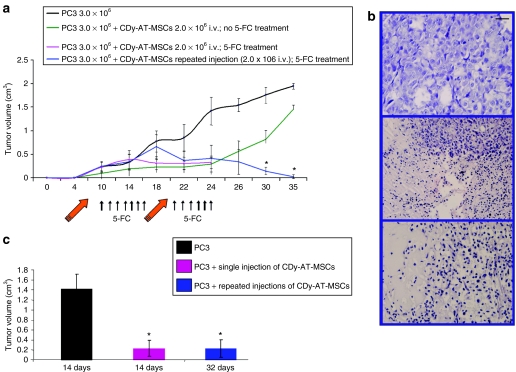
Figure 5.
Systemically administered CDy-AT-MSCs exert antitumor effect in the presence of 5-FC (a) Tumors were induced with 3.0 ×10⁶ PC3 cells (without Matrigel) by subcutaneous inoculation into flank of each nude mouse in all four animal groups. Control group (n = 6) received tumor cells without any treatment. Animals in the second control group (n = 3) received equal number of tumor cells and were successively inoculated intravenously (i.v.) with 2.0 × 10⁶ of CDy-AT-MSCs and not treated with 5-FC. The third group of animals (n = 8) received 3.0 ×10⁶ PC3 cells, were inoculated i.v. with a single dose of 2.0 × 10⁶ of CDy-AT-MSCs, and were treated daily with 500 mg/kg of 5-FC intraperitoneally starting on fourth day after therapeutic cells inoculation. On day 24, animals were killed and tumors examined by histopathology. The fourth group of animals (n = 6) received two doses of therapeutic cells, as indicated in the figure by the orange arrows. On day 36 animals were killed. Tumor volumes were measured at the indicated time points and expressed as mean ± SD. *P < 0.05. (b) Hematoxylin-eosin staining of PC3 tumors from control animals (upper panel), from animals treated with single dose of CDy-AT-MSCs (middle panel), and from animals treated with two doses of CDy-AT-MSCs (lower panel). (c) Nude mice were inoculated with 3.0 × 10⁶ PC3 cells mixed with the same volume of Matrigel. Control group animals (n = 6) received tumor cells only. Animals in the second group (n = 9) were inoculated i.v. with one dose of 2.0 × 10⁶ of CDy-AT-MSCs. These two groups of animals were killed on day 14, tumor volume was estimated and histopathologic examinations performed by hematoxylin-eosin staining. Mice of the third group (n = 9) received a second injection of 1 × 10⁶ of CDy-AT-MSCs on day 18. Tumor volumes were measured on day 32 and expressed as mean ± SD. *P < 0.05. AT-MSCs, adipose tissue–derived mesenchymal stem cells; 5-FU, 5-fluorouracil.

