
Figure 4.
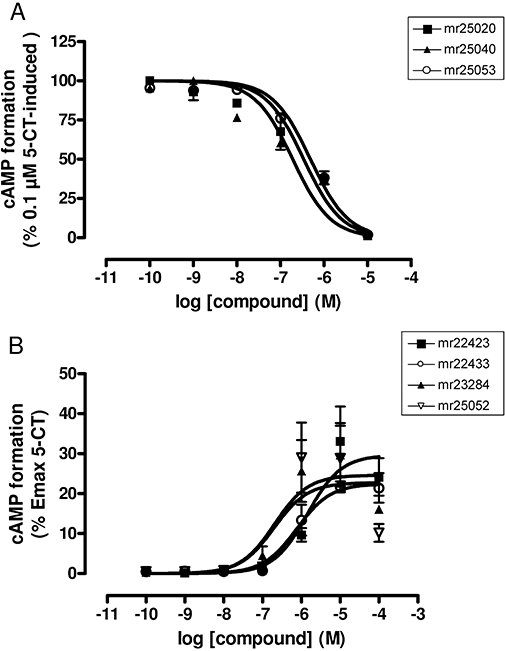
Functional characterization of selected compounds at human 5-HT7 receptors. (A) Concentration–response curves of compounds mr25020, mr25040 and mr25053 inhibiting the cAMP formation elicited by 0.1 µM 5-CT. Data represent the mean ± SEM (vertical bars) of two independent (n = 2) experiments performed in duplicate. (B) Concentration–response curves of compounds mr22423, mr22433, mr23284 and mr25052 measuring the formation of intracellular cAMP. Data are expressed as the % of the maximal cAMP formation induced by 5-CT and represent the mean ± SEM (vertical bars) of two independent (n = 2) experiments performed in duplicate.