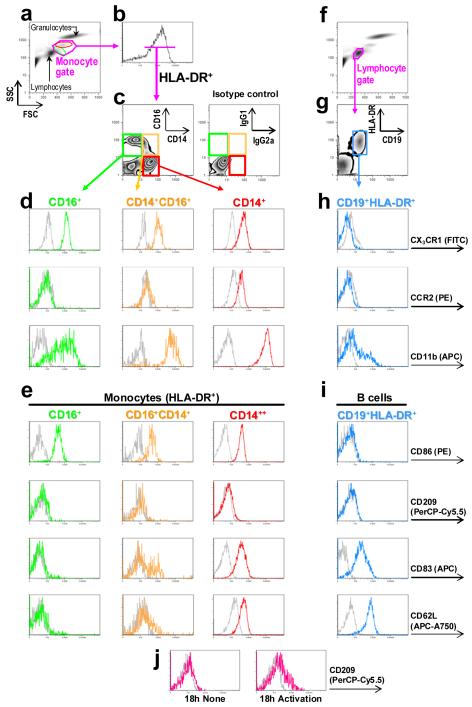
Figure 2.
Flow cytometric analysis of monocyte subsets and CD19+HLA-DR+ B lymphocytes in whole blood. (a) CD16+ ‘resident’ and CD14+ ‘inflammatory’ monocytes have preponderant localizations on a FSC (linear) vs SSC (logarithmic) bivariate plot (green and red ovals, respectively), owing to their different intrinsic biophysical properties. Cells within the monocyte gate (pink enclosure) are selected for (b) expression of HLA-DR–PerCP and further separated based on (c) expression of CD14–Pacific Orange and CD16–Pacific Blue, and displayed on a quantile contour (zebra) plot. Negative controls, nonspecific mouse IgG2a and IgG1, matching the respective fluorochrome and immunoglobulin isotypes of CD14 and CD16, respectively, show no significant positivity. (d) CD16+HLA-DR+ (green), CD14+CD16+HLA-DR+ (yellow) and CD14+HLA-DR+ (red) monocyte subsets are analyzed further for their expression of CX3CR1–FITC, CCR2–PE and CD11b–APC, and (e) CD86–PE, CD209–PerCP-Cy5.5, CD83–APC and CD62L–APC-Alexa Fluor 750, as shown in one-dimensional histograms. B lymphocytes are analyzed from (f) cells localized to the lymphocyte gate that (g) express CD19 and HLA-DR. Histograms illustrate B-cell expression profiles of (h) CX3CR1, CCR2 and CD11b, and (i) CD86, CD209, CD83 and CD62L in parallel with monocytes co-immunostained in the same reactions. (j) Functionality of the anti-human CD209 antibody in PerCP-Cy5.5 is demonstrated in a separate reaction by activation of peripheral whole blood with IL-1β (10 ng/ml), TNF-α (50 ng/ml), IFN-γ (1000 U/ml; Peprotech) and ultra-pure lipopolysaccharide (100 ng/ml; InvivoGen); cells in the monocyte gate expressing CD11c and HLA-DR are shown.

