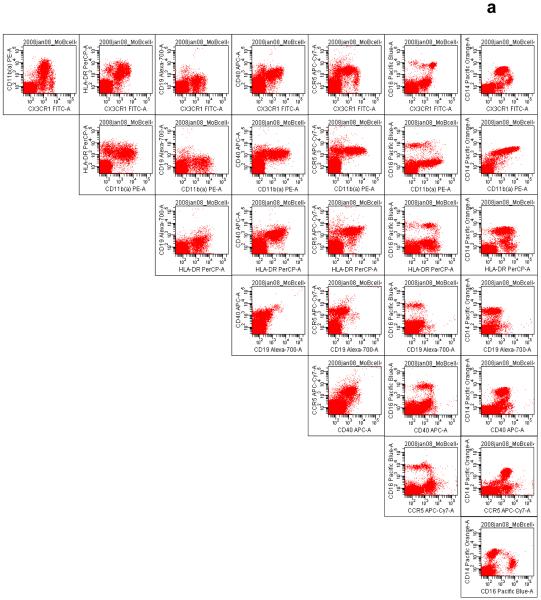
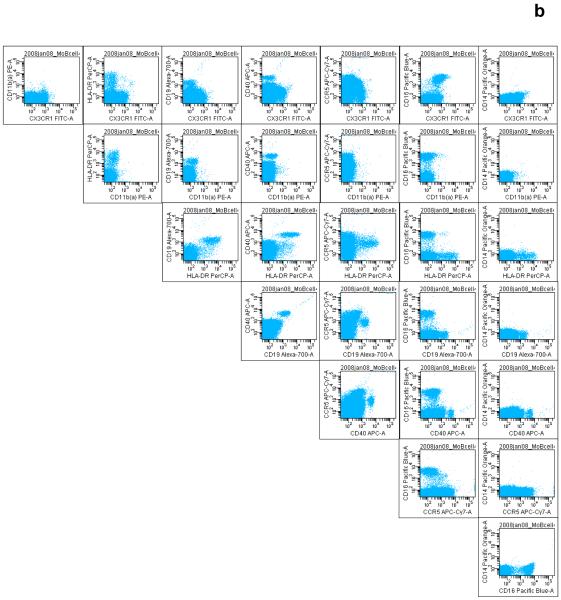
Figure 4.
The systematic display of antibody–fluorochrome pairs created in the Worksheet window of the BD FACSDiva software is useful in organizing the large number of bivariate plots, for visualizing the correct spectral overlap compensation, quality control and for discovering novel cell subsets. This mode of display is also useful for visualizing single-color staining and for ascertaining fluorochrome ‘spillover’. Acquisition events or cells captured in the (a) monocyte gate and (b) lymphocyte gate are shown. Antibodies demonstrated include those targeting CX3CR1–FITC, activated CD11b (CD11b(a))–PE, HLA-DR–PerCP, CD19–Alexa Fluor 700, CD40-APC, CCR5–APC-Cy7, CD16–Pacific Blue, and CD14–Pacific Orange (see Table 1 for details).


