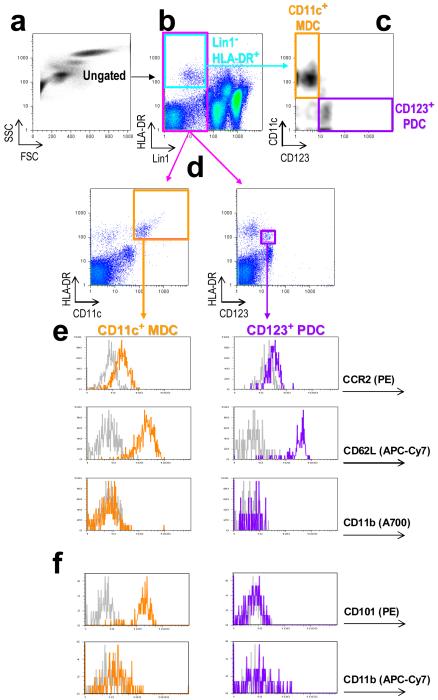
Figure 5.
Analysis of two major DC subsets in whole blood. (a) Ungated cells that are (b) Lin1−HLA-DR+ (within pale-blue box) are analysed on a (c) bivariate density plot showing CD11c vs CD123 expression levels to allow for identification of MDCs (within orange box) and PDCs (within purple box), respectively, and for determination of DC subsets ratio or percentages. To profile expression levels of specific surface antigens on DC subsets, (b) Lin1− cells (within pink box) are gated on and further analysed for (d) CD11c+HLA-DR+ and CD123c+HLA-DR+ expression, corresponding to MDCs (orange) and PDCs (purple), respectively. Histograms show (e) expression levels of CCR2–PE, CD62L–APC-Cy7 and CD11b–Alexa Fluor 700, and (f) of CD101–PE and CD11b–APC-Cy7.

