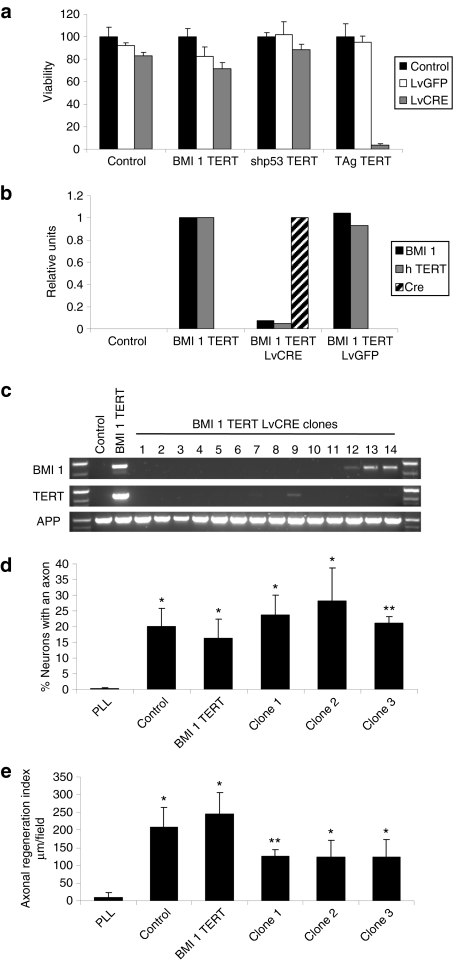
Figure 4.
Cell survival and neuroregenerative function after deimmortalization. (a) Viability (as measured by the MTT assay) of control human olfactory ensheathing glia (hOEG) or those immortalized by BMI1/TERT, TAg/TERT, and shp53/TERT determined 1 week after infection [multiplicity of infection (MOI): 10] with a control lentivector (LvGFP) or a lentivector expressing Cre recombinase (LvCRE). Graphs show mean values and bars indicate the standard deviations of three independent samples. (b) Quantitative reverse transcription–PCR measurement of transgene expression in control hOEG or those immortalized by BMI1/TERT determined 1 week after infection (MOI: 10) with a control lentivector (LvGFP) or a lentivector expressing Cre recombinase (LvCRE). Real-time PCR was carried out on reverse-transcribed total RNA purified from infected and control cells as described in Materials and Methods using primers specific for transgenic BMI1 (black bars), TERT (gray bars), and Cre (hatched bars). (c) PCR analysis of genomic DNA derived from control hOEG, those immortalized by BMI1/TERT, and individual clones derived from BMI1/TERT-immortalized OEG after treatment with Cre recombinase. Specific oligonucleotide pairs were used to detect transgenic BMI1 and TERT DNA whereas a third oligonucleotide pair specific for the endogenous human amyloid precursor protein was used as a control for DNA loading. (d,e) Neuroregenerative capacity of deimmortalized clones in the adult rat retinal ganglion neuron coculture assay. Graphs show means and standard deviations derived from three independent experiments represent the (d) percentage of neurons exhibiting axons and (e) the axonal regeneration index, a parameter reflecting the average length of axons regenerated. Cell passage number in these experiments was 9 for control cells and 36–37 for the rest of the cells. The P values (in d and e, with respect to PLL) are shown as: *P < 0.05 and **P < 0.01.

