
Figure 1.
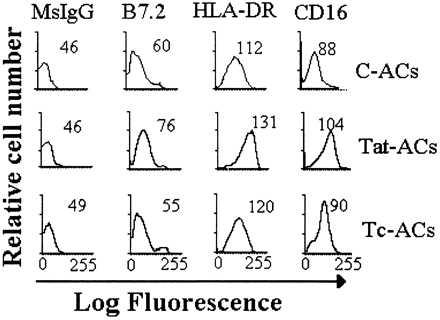
Flow cytometric analysis of cell surface antigens of ACs. ACs were cultured for 4 days in either the presence or absence of 1 μM Tat protein and then stained with indirect immunofluorescence by using control mouse mAb (MsIgG) or mAbs against B7.2, HLA-DR, or CD16 antigens. The numbers represent the mean fluorescent intensity for analysis of 10,000 events.