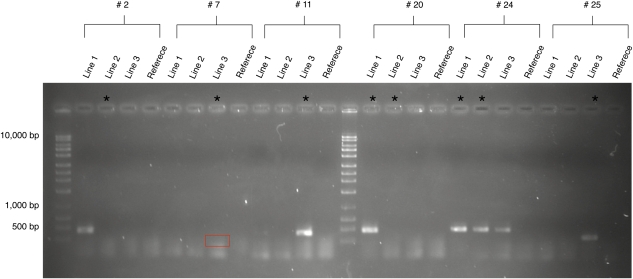
FIG. 3.—
PCR confirmation of six Class 1 structural events. Asterisks indicate the lines in which the event was predicted by the paired-end data. Class 1 #2 is an example of an event that was confirmed in a different line than the one in which it was predicted. Class 1 #20 shows an event that was confirmed in one of the two lines in which it was predicted. Class 1 #24 shows an event that was predicted in two lines and confirmed in all three lines. The box in Class 1 event #7 highlights a faint band.

