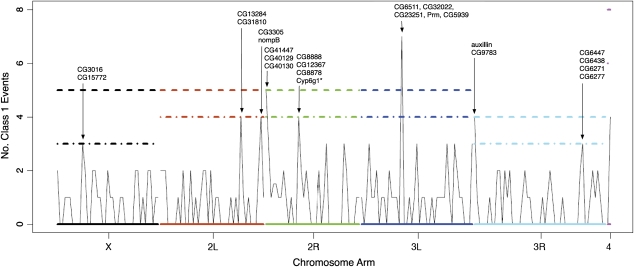
FIG. 6.—
The number of Class 1 read-pairs of 32 kb or less in nonoverlapping 500 Kb windows. This includes confirmed Class 1 events detected by two or more read-pairs and Class 1 events indicated by only one read-pair. The dashed line represents the a P value of ≤ 0.001, given the chromosome mean and assuming a Poisson process (for details, see text). The dot-dashed line represents P ≤ 0.01. The P values are not corrected for multiple tests. The genes listed above the peaks in the figure are genes located in that window identified by read-pairs in our data set. Genes marked with an asterisk are from our confirmed set.

