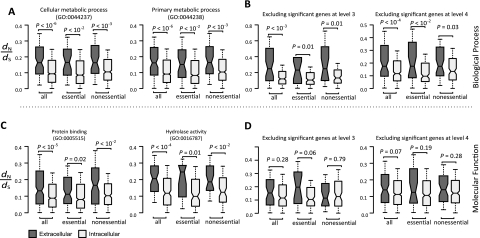
FIG. 2.
Higher dN/dS of extracellular proteins than intracellular proteins are observed even after the control of biological processes (A, B) or molecular functions (C, D). (A) and (C) were performed by comparing proteins of the same GOs at level 3 (left and right are top first and second differentially enriched terms, respectively), whereas (B) and (D) were performed by removing all genes with significantly differentially enriched GO terms at level 3 (left) or level 4 (right). See legend of figure 1 for details of the boxplot and supplementary figure S2 (Supplementary Material online) for the results of dN and dS.

