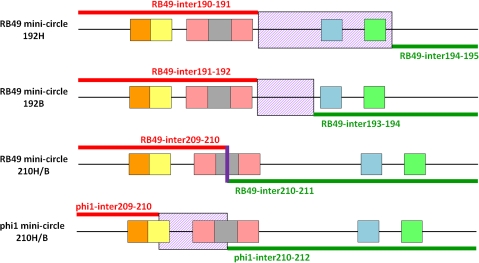
FIG. 5.—
Schematic diagram of the observed PeSL mini-circles indicating the positions/zones where recombination between the pairs of PeSLs occurred. Alignments of the sequenced PeSL mini-circle sequences compared with the phi1 and RB49 genomes showing the regions of 100% homology on either side of the crossover (red and green lines), as well as the zones (violet hashed box) or exact point (violet line) of exchange events. The different PeSL elements are color coded as in fig. 3.

