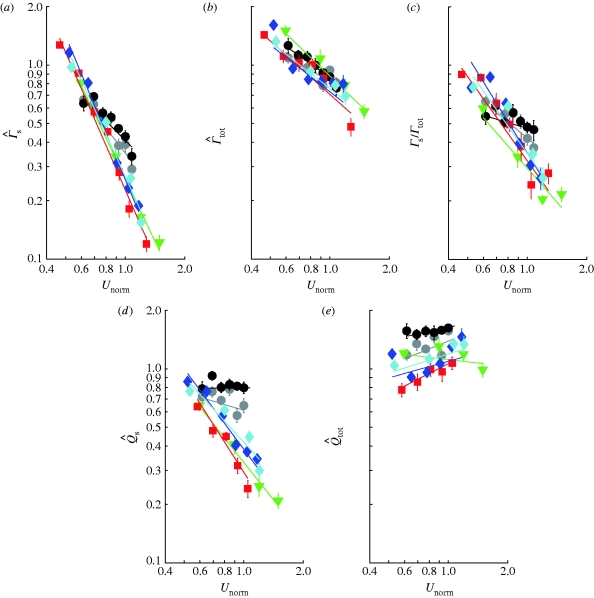
Figure 1.
Comparison of bird and bat quantitative wake data plotted against normalized flight speed (U
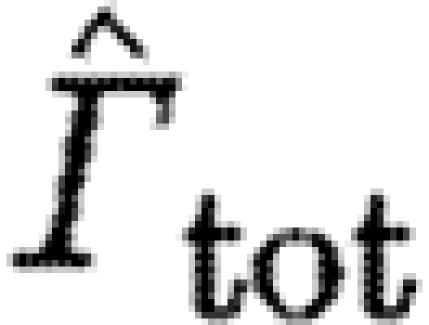
norm). (a) Normalized start vortex circulation,  . (b) Normalized total circulation of start sense,
  . (c) The circulation of the dominating start vortex relative to the total circulation of start sense (Γ
s/Γ
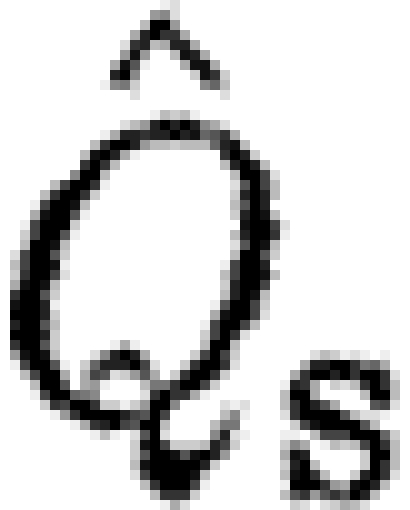
tot). (d) The normalized wake loading based on start vortex circulation,
  , and (e) based on total circulation of start sense,
  . The data are means±s.e.m. and the lines are fitted power regressions for each individual (grey circles, bat 11; black circles, bat 17; green down triangles, HM; red squares, TN; blue diamonds, ROw; turquoise diamonds, ROr).

