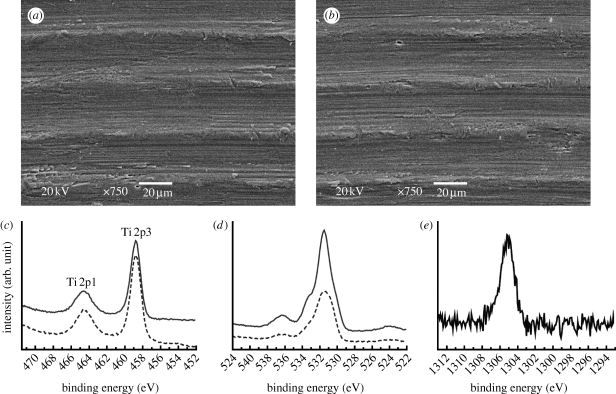
Figure 5.
Surface property control. (a,b) The similarity of the surface topography: SEMs show nearly identical texture between (a) the control and (b) test implants, characterized by uniformly orientated margin and grooves, having a wavelength of approximately 30 μm. Scale bar, 20 μm. (c–e) The difference of surface chemistry: XPS high-resolution spectra showed the peak intensities of (c) the Ti 2p3/2 at 458.8 eV and (d) the O 1s at 530.1 eV for the control (solid line) and test (dashed line) implants, respectively, and (e) the peak intensity of the Mg 1s at 1305.2 eV for the test implants.

