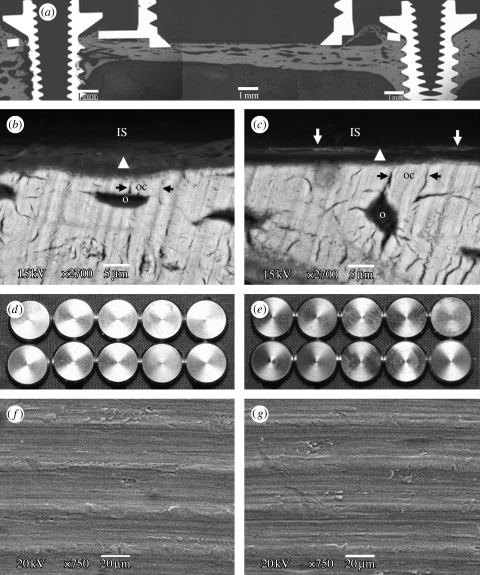
Figure 7.
Fracture analysis of the bone–implant interface after the pull-off test. (a) SEM observation of a cross section of the TBS device in bone. SEM observation on the bone side removed from (b) the control (OPIII) and (c) test (MgPIII) surfaces. Bond failure occurs between the ISs (removed by the pull-off measurement) and tissue represented by an amorphous layer of woven bone (arrow head). The amorphous layer between the (removed) IS and fully mineralized mature bone showed different behaviour for the control and test ISs: (i) the contact distance of the IS to the mature bone, i.e. the thickness of the amorphous layer, and (ii) the degree of mineralization. In the test surface, the amorphous layer is rather thin and shows more pronounced mineralization, indicated by the backscattered electron-dense lines of approximately 2 μm width (white arrow) close to the IS, whereas the control surface contacts the thick amorphous layer without the electron-dense tissue line. In the fully mineralized mature bone, osteocytes (o) are adjacent to the amorphous layer and the osteocyte canaliculi (oc, black arrow) direct to the IS. Electron beam exposure in the imaging BSE mode, 15 kV. Scale bars, 5 μm. (d–g) Analysis of the retrieved ISs. No bone growth onto (d,f) all the control surfaces and (e,g) the test surfaces, 10 of each group, is observed. Scale bars, 20 μm. Note that the retrieved implants still have similar surface texture as shown in figure 5 a,b prior to bone contact.

