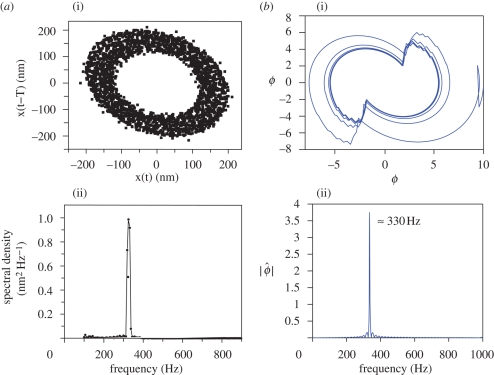
Figure 3.
Free oscillations of the antenna: experimental results (a) (reproduced with permission from Jackson (2007)) versus numerical simulations (b). Parameters for the numerical simulations are δ = 0.5, κ = 1.0625, α = 0, λ1 = 2, λ2 = 4, Δ = 2.5, σ = N = 10 and β = 1/N. (a(i), b(i)) Phase plane representation of the free oscillations. (a(ii), b(ii)) Power spectrum of the oscillations; the frequency peak is located at approximately 330 Hz.

