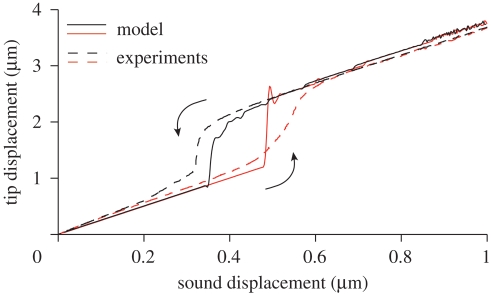
Figure 5.
Hysteresis diagrams: numerical simulation (solid lines) compared with experimental results in Jackson et al. (in press) (dashed lines). In both settings, the amplitude of the applied sound field is increased (red) and then decreased (black) quasi-statically. The amplitude of the oscillations is plotted on the vertical axis. Hysteresis is found when the excitation frequency is slightly below the natural frequency of the system. Numerical parameters used for the simulations: δ = 0.2, κ = 1.01, λ1 = 2, λ2 = 10, Δ = 2.5, σ = 120 N, N = 20, β = 8/N, ωs/Ω = 0.87.

