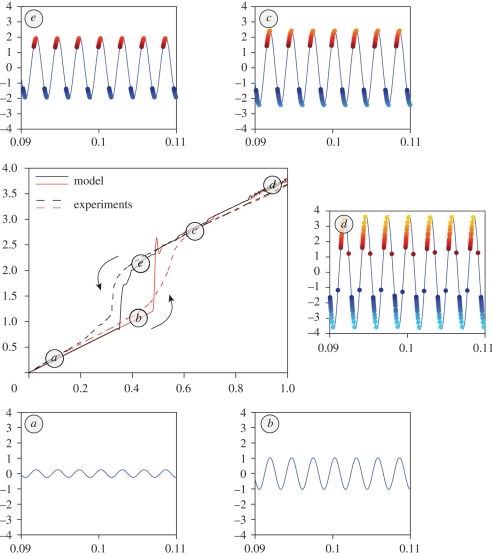
Figure 6.
Different stages of the hysteresis diagram. In the central panel, we have reproduced the hysteresis diagram of figure 5. (a and b) The threads are quiescent, as their geometric activation threshold σ has never been reached. (c) The threads are all active, and they induce nonlinear amplification. (d) At saturation, threads ± N twitch constructively twice per period. (e) In this regime, nonlinear amplification is sustained by a low number of threads.

