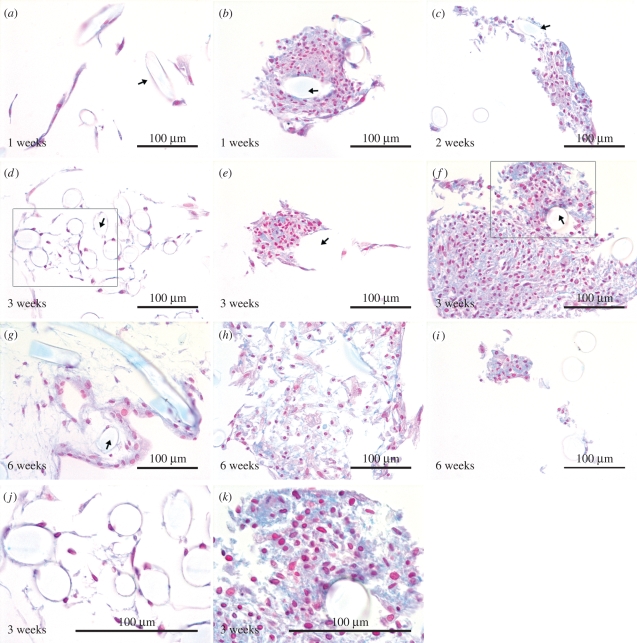
Figure 3.
The ASC discs stained with Alcian blue. The control ASC discs (a,d,g) are represented on the left column and the ASC discs under differentiation conditions (b,c,e,f,h,i) in two columns on the right. Boxes in (d) and (f) represent areas shown at higher magnifications in (j) and (k), respectively. Arrows indicate locations of the P(L/D)LA 96/4 fibres. The ASC discs are chosen from the different experiments, and the ASC discs 1 and 2 are not separated in the panel owing to general similarity in their behaviour.

