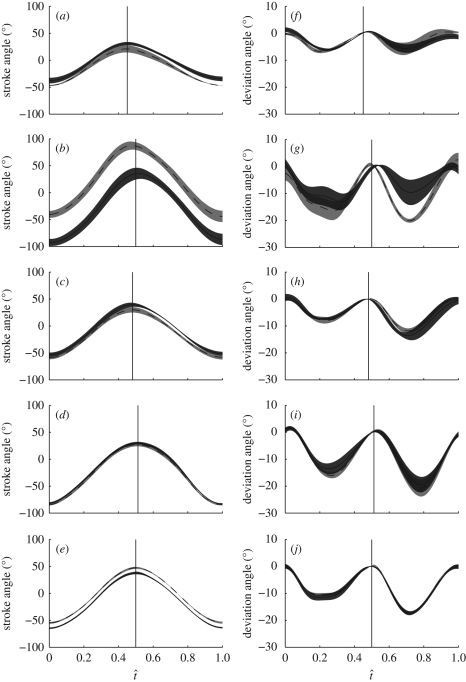
Figure 2.
Stroke angle (a–e) and deviation angle (f–j) against normalized time through the wingbeat (t̂) for the five hoverflies (a,f, H1; b,g, H2; c,h, H3; d,i, H4; e,j, H5). Solid lines, left wing; dashed lines, right wing. The shaded region around each line displays the s.d. over the wingbeats measured. The downstroke begins at t̂ = 0 and ends at the point denoted by the vertical line, which marks the mean timing of the start of the upstroke.

