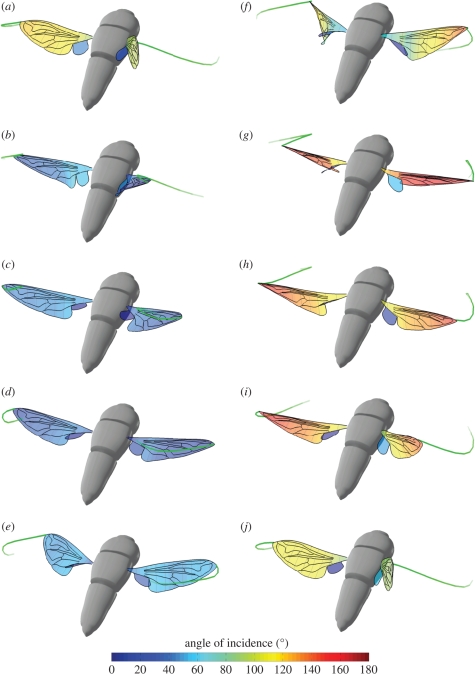
Figure 3.
Three-dimensional projection of hoverfly H5 to show how the angle of incidence varies across the wings at 10 different stages of a single wingbeat. ((a) t̂ = 0.0; (b) t̂ = 0.1; (c) t̂ = 0.2; (d) t̂ = 0.3; (e) t̂ = 0.4; (f) t̂ = 0.5; (g) t̂ = 0.6; (h) t̂ = 0.7; (i) t̂ = 0.8; (j) t̂ = 0.9, where t̂ is the normalized time through the wingbeat.) The wings are coloured by the angle of incidence. A scaled model of the hoverfly body is also shown for reference. The green wisps at the wing tips show the immediate time history of the wing tip position to convey a sense of the wing's motion. The wing is twisted throughout the wingbeat, but is most noticeably twisted just after supination (f), when a torsional wave passes along the wing from wing-tip to wing root.

