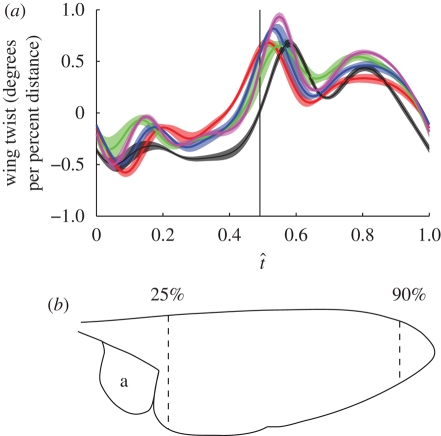
Figure 6.
(a) Average slope of linear regression of angle of incidence against distance along the wing, plotted against normalized time through the wingbeat (t̂) for each of the five hoverflies. The solid lines show the mean slope for both wings (red, H1; green, H2; blue, H3; black, H4; magenta, H5) and the shaded region around those lines displays the s.d. over the wingbeats measured. The vertical solid line indicates the mean timing of the start of the upstroke. (b) Outline of a hoverfly wing showing the location of the limits to the wing length used in the linear regression analysis. Distances near the wing root (under 25% wing length) and wing tip (over 90% wing length) were excluded from the regression analysis because the measurement error is inversely related to the chord length, and because the presence of a hinged flap at the base of the wing (alula: lettered a) causes discontinuities (see §3.5).

