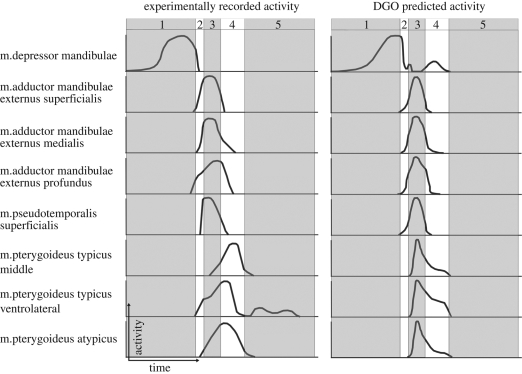
Figure 6.
Comparison of experimentally recorded activation data (adapted from Gorniak et al. (1982)) and activation data predicted through dynamic geometry optimization. 1, jaw-opening phase; 2, jaw-closing phase; 3, food-crushing phase; 4, anterior jaw-shearing phase; 5, resting phase. The bar chart data of Gorniak et al. (1982) have been redrawn as curves and all plots have been scaled to peak activity. y-axis relates to muscle activity and x-axis relates to time/biting phases.

