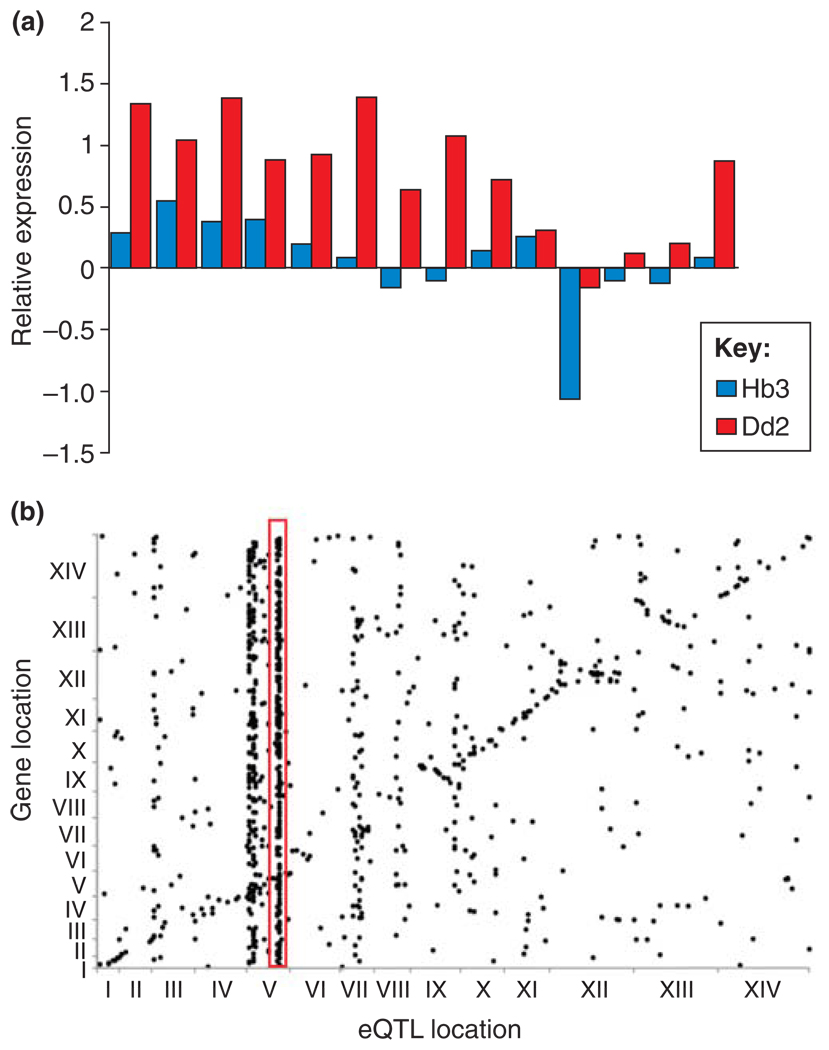
Figure 2.
CNP and expression variation. (a) Cis regulation. The bar chart compares levels of expression (relative to 3D7) in the progeny of the HB3 × Dd2 genetic cross for 14 genes on chromosome 5. Mean expression levels in progeny inheriting this region of chromosome 5 from Dd2 and carrying multiple copies of these genes are compared with expression levels of progeny carrying a single copy of these genes inherited from Hb3. In all 14 genes, expression level is higher in progeny carrying multiple copies of these genes inherited from Dd2. These data demonstrate a strong impact of CN on local (cis) expression variation. (b) Trans regulation. The dot plot summarizes results of a linkage analysis designed to identify genome regions controlling expression phenotypes in the HB3 × Dd2 genetic cross. The genomic position of each gene for which expression was quantified is shown on the y-axis, and the genome position of the QTLs controlling expression at each gene is shown on the x-axis. The dots forming a diagonal line show genes that are under local (cis) control. However, some QTLs control expression of multiple genes in the genome. These are evident as vertical stacks of dots. The red box highlights the strong trans-regulatory QTL on chromosome 5 that co-localizes with the pfmdr1 amplicon. These data demonstrate how one CNP can dramatically alter genome-wide expression profiles. Redrawn, with permission, from data reported in Ref. [18].

