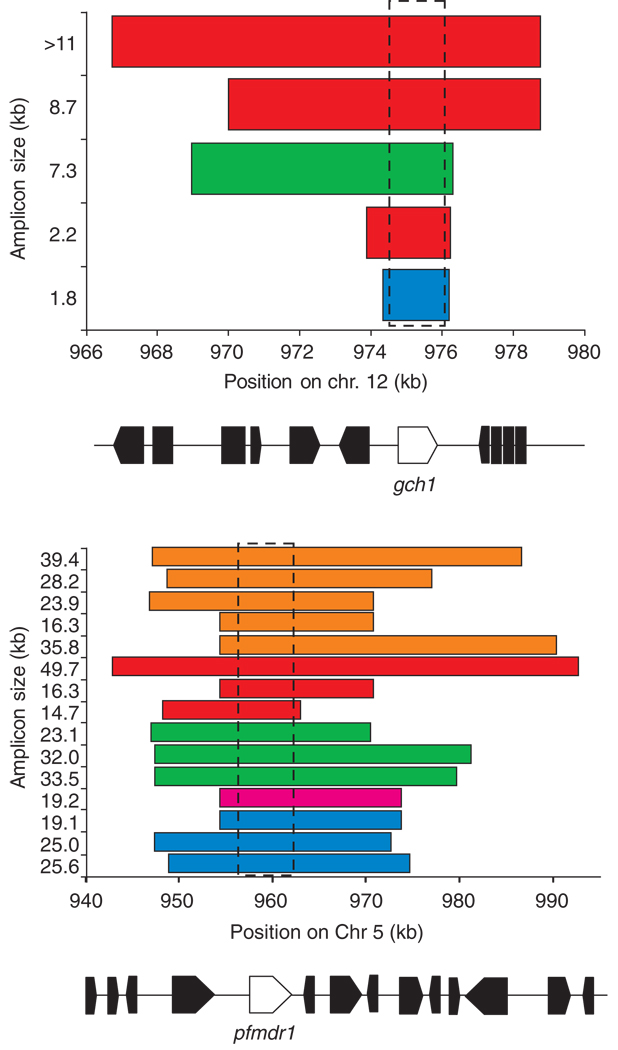
Figure 4.
Complex evolution of CNP in P. falciparum. Bar plots show the different amplicons observed on (a) chromosome 12 and (b) chromosome 5 in parasites sampled from a single clinic on the Thailand---Burma border. The x-axis shows the span of each amplicon, and the size of each amplicon (kb) is shown on the y-axis. Gene maps of the region are shown beneath the x-axis, with gch1 and pfmdr1 shown in white and flanking genes shown in black. The amplicons are shown in different colors to show whether they have similar flanking microsatellite haplotypes, suggesting a common origin. The positions of pfmdr1 and gch1 are marked by boxes. We observed strong evidence for parallel evolution of CN amplification in both cases, as well as evidence that amplicons of different sizes share the same origins. The figure also illustrates how characterization of amplicons can effectively identify genes underlying particular phenotypes. In both cases, amplicon boundaries define a single gene --- pfmdr1 on chr 5 and gch1 on chr 12 --- that underlie adaptation to drug treatment. Adapted, with permission, from Refs [19,22].

