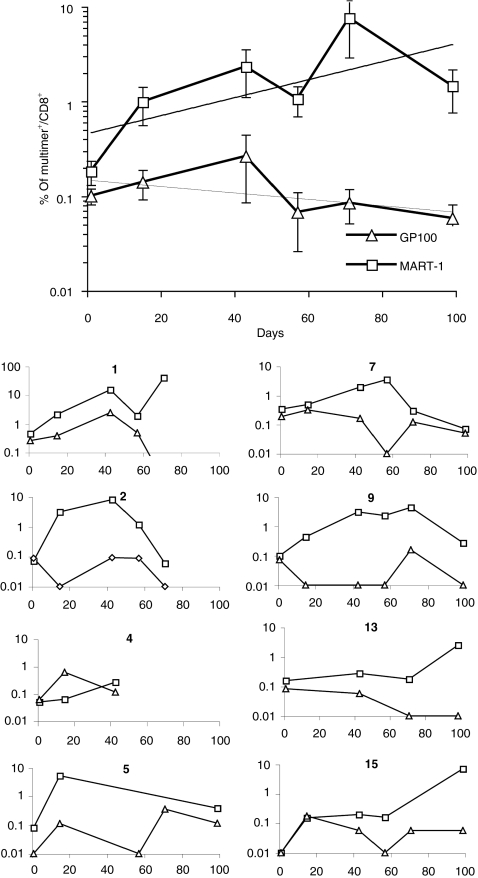
Figure 3.
Phenotypic monitoring of CD8+ T cell response by multimer staining. CD8+ T cells from the indicated patients participating to the study were cultured in the presence of gp100280–288 (triangles) or Melan-A/MART-127–35 (squares) peptides as detailed in “Materials and Methods”. Cells were then stained with the corresponding HLA-A0201 multimers and anti-CD8. Specific binding was evaluated by flow cytometry. Data are reported as percentages of CD8+ T cells. The top panel refers to the average ± SEM including trend lines, of all observed values from the 15 patients treated. The 10 small panels, labeled with patients' numbers detail data from each individual responsive patient.

