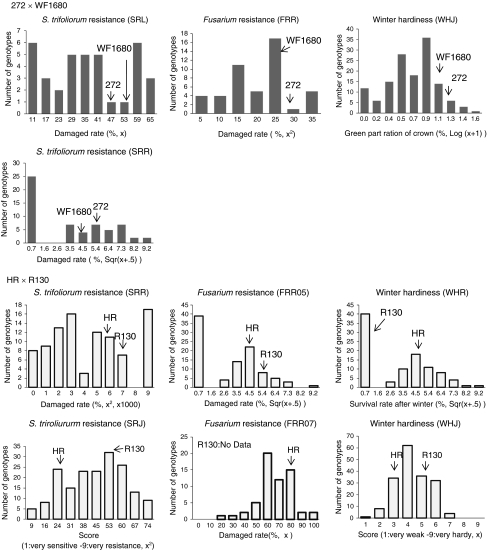
Fig. 1.
Frequency distributions of the traits relating to plant persistency in red clover populations 272 × WF1680 and HR × R130. Parental values of phenotypes are indicated by arrows. The transform functions used to convert the data to normal distributions are described in parentheses on the X-axis title

