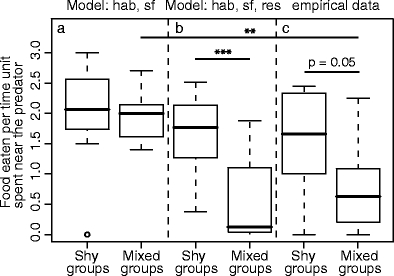
Fig. 5.

Average number of food items eaten during each time step spent near the predator of shy individuals in shy groups, and shy individuals in mixed groups. Results from a model with habituation and social facilitation (a), a model with habituation, social facilitation, and prior residence (b), and from Magnhagen and Staffan (2005) (c). Boxes represent median ± quartile. Asterisk indicates significant differences (Mann-Whitney U test). **p < 0.01, ***p < 0.001
