
Figure 1.
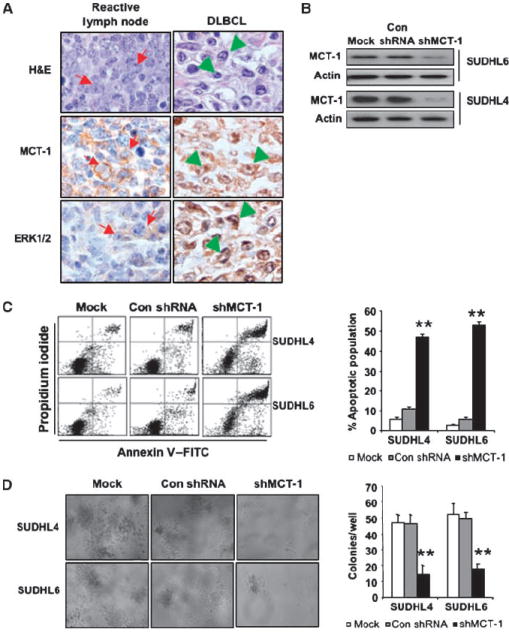
Knockdown of MCT-1 by shRNA induces apoptosis and reduces their clonogenic capacity. A, immunostaining of DLBCL shows MCT-1 and ERK1/2 expression in reactive germinal center B-cell centroblasts (arrows) and DLBCL cells (arrowheads; original magnification, ×1,000). Top, MCT-1 staining; bottom, ERK staining. B, SUDHL4 and SUDHL6 cells were transduced with a lentivirally encoded MCT-1 shRNAs (hairpin no. 3; shMCT-1) and control shRNA (Con). MCT-1 expression was monitored by Western blot analysis. Mock indicates nontransduced cells. C, at 72 h after transduction, cell apoptosis was measured via Annexin V and propidium iodide staining. Flow cytometric profile was showed in the left panel. Columns, mean of three independent experiments; bars, SD. ANOVA was determined by Student’s t test relative to control shRNA. **, P < 0.01. D, SUDHL4 and SUDHL6 cells were transduced with shMCT-1 and control shRNA. On day 9, colony formation was examined and photomicroscopy of SUDHL4 and SUDHL6 cell colonies was taken in soft-agar plates at ×10 magnification (left). Right, quantification of colony formation. The colony numbers were counted in each well of SUDHL6 and SUDHL4 cell colonies. Columns, mean of four experiments; bars, SEM.