
FIGURE 1.
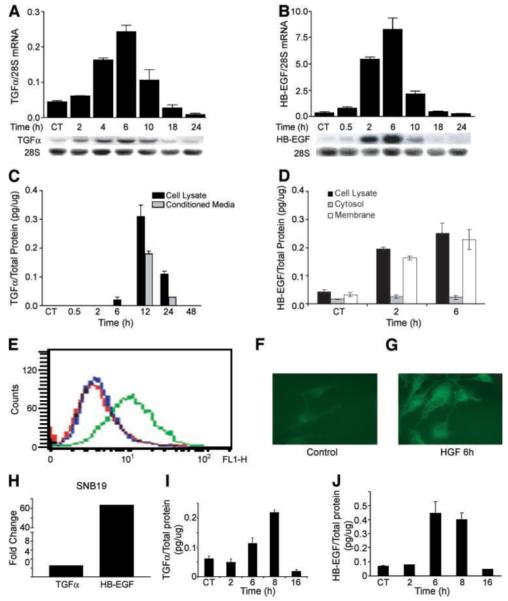
HGF induces TGF-α and HB-EGF mRNA and protein expression in human glioma cells. A and B. U373MG cell monolayers were acclimated to low serum conditions (0.1% FBS) overnight then treated with recombinant human HGF (20 ng/mL) for the indicated times, and then total cellular RNA was isolated. Northern analysis, as described in Materials and Methods, reveals induction of TGF-α (A) and HB-EGF (B) gene expression. Data represents the increase of TGF-α and HB-EGF normalized to 28S rRNA. C and D. U373MG cells were treated ±HGF as in A. At the indicated times, conditioned medium and cell layers, as well as membrane fractions, were isolated and subjected to ELISA for TGF-α (C) or HB-EGF (D) as described in Materials and Methods. TGF-α or HB-EGF concentrations are normalized to total cell layer protein. E-G. Cell surface HB-EGF was determined by flow cytometric analysis of live cells (E) and by immunofluorescence of nonpermeabilized cells (F and G) 6 h after stimulation with HGF. For flow cytometry, cells analyzed with control primary antibody are shown in red and cells analyzed with anti-HB-EGF monoclonal antibody after incubation with buffer only or with HGF are shown in blue and green, respectively. Immunofluorescence in nonpermeablized cells confirms that, when compared with control cells (F), HGF induces cell-associated, likely cell surface, HB-EGF (G; n = 3). Experiments were repeated thrice at a minimum. H-J. SNB19 glioma cells were treated ±HGF as described above. Total cellular RNA was isolated 6 h after cell stimulation with HGF assayed for TGF-α and HB-EGF mRNA (H), and cell layer protein was isolated at the indicated time points and assayed by ELISA for TGF-α (I) and HB-EGF (J) as described above.