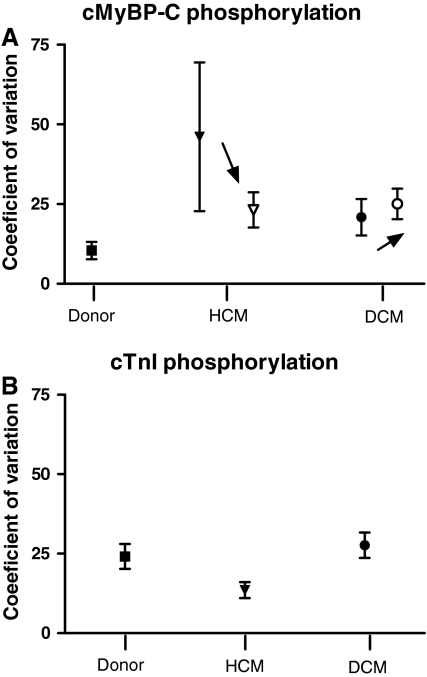
Fig. 3.
The coefficient of variation, a measure of how much the individual values of each heart differed from the mean, was on average not significantly different between donor, HCM and DCM for the phosphorylation status of cMyBP-C (a) or cTnI (b) (closed symbols). Within the analysis of cMyBP-C phosphorylation, exclusion of outliers (HCM 1 and DCM 3) lowered the mean coefficient of variation and the SEM in HCM, while the average coefficient of variation of the DCM group was slightly increased (as indicated by the arrow, open symbols). After exclusion of the outliers there was still no significant difference in coefficient of variation among the groups. Groups were compared by one-way ANOVA, P < 0.05 was considered significant

